KEY TAKEAWAYS
*Recent Dimensional research suggests that simply staying invested helps outpace inflation over the long term for a wide range of asset classes.
*The protection offered by inflation-indexed securities still appears to be the
most effective for investors who are particularly sensitive to unexpected
inflation.
*Our analysis of data from 1927–2020 covers periods with double-digit US
inflation as well as periods with deflation.
 US consumer prices were up by 5.4% for the year ending June 2021, the largest annual increase since August 2008.1 Naturally, inflation is at the center of attention for many US investors.
Our recent paper US Inflation and Global Asset Returns provides some good news for investors looking to outpace inflation over the long term. But it also contains some sobering facts for investors trying to hedge against inflation through alternatives to inflation-indexed securities.
INFLATION OUTPACED
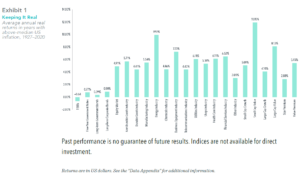
Exhibit 1 shows average real returns (that is, returns net of inflation) to different asset classes in years with high (above-median) inflation from 1927 to 2020. We consider a total of 23 US assets that span bonds, stocks, industries, and equity premiums. Over this period, inflation averaged 5.5% per year in high-inflation years. While average real returns were mostly lower in years with high inflation compared to years with low inflation, the exhibit shows that all assets except one-month T-bills had positive average
real returns in high-inflation years.
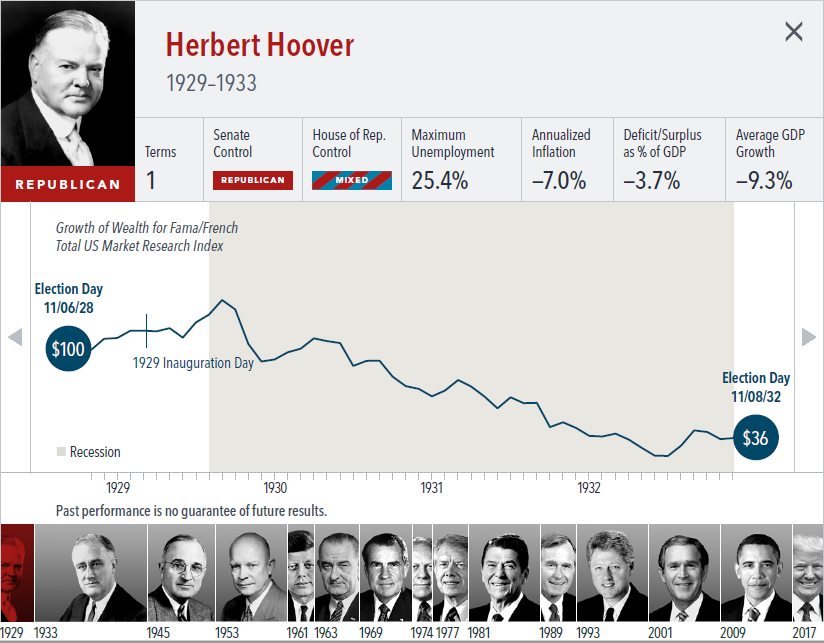
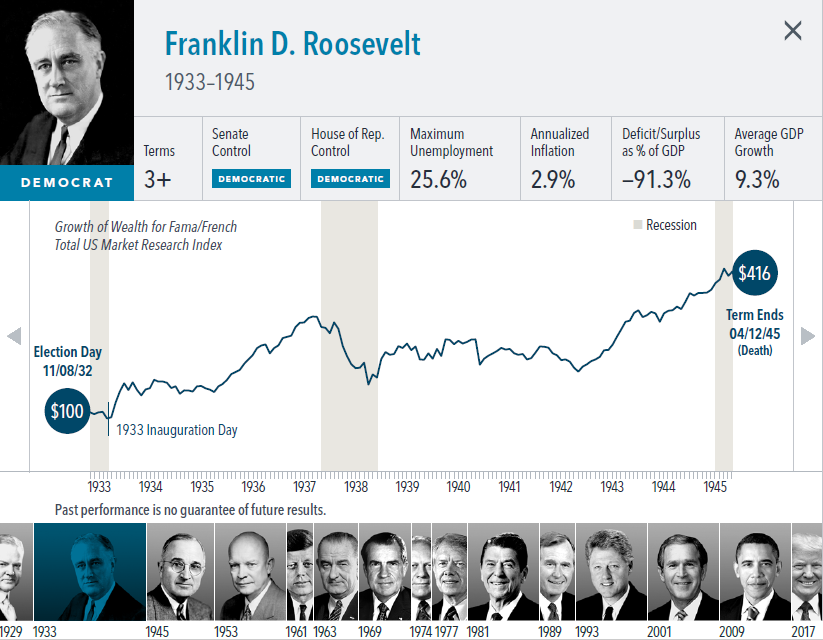
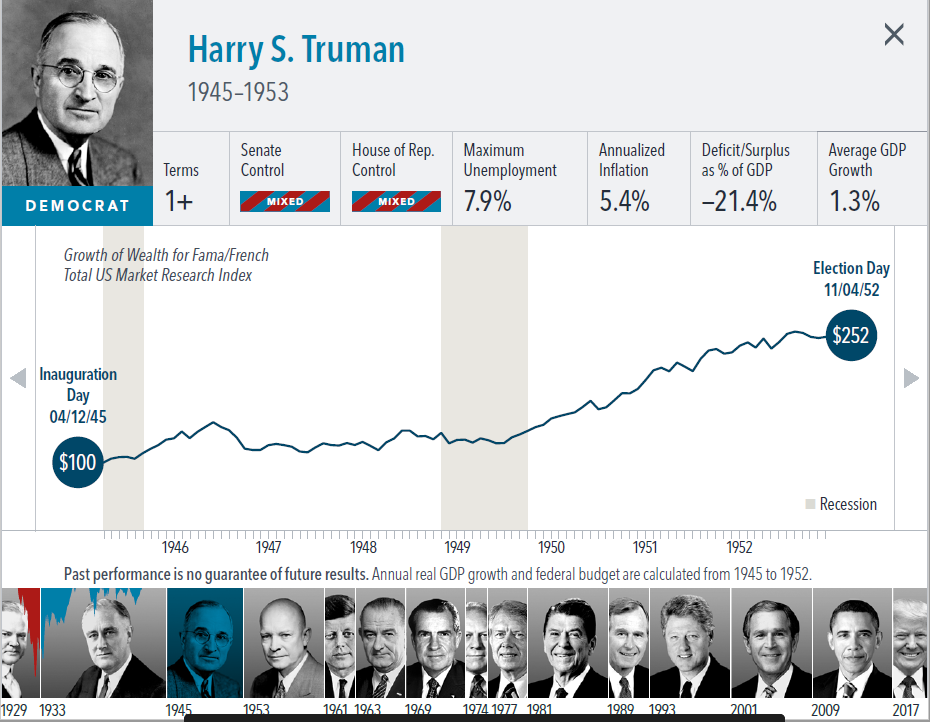
The analysis over 1927–2020 is useful because it covers periods with double-digit US inflation (like the 1940s and ’70s) as well as periods with deflation (like the Great Depression, 1929–32). But we find similar results over the most recent 30-year period (1991–2020), when US inflation was relatively mild and stable. Over this period, we also expand our analysis to non-USD bonds, developed- and emerging-market equities, real estate investment trusts (REITs), and commodities. Overall, outpacing inflation over the long term has been the rule rather than the exception among the assets we study.
INFLATION HEDGED
Despite the reassuring findings presented above, emphasizing growth assets that have historically outpaced inflation may not be appropriate for everyone. If you’re highly sensitive to inflation and have a low tolerance for market risk, you’ll likely want some exposure to inflation-indexed securities (such as TIPS and inflation swaps), and with good reason: they are designed to provide inflation protection. While stocks from certain industries, REITs, commodities, and value stocks are sometimes considered “inflationsensitive”
assets, the data provide little support that they are good inflation hedges.
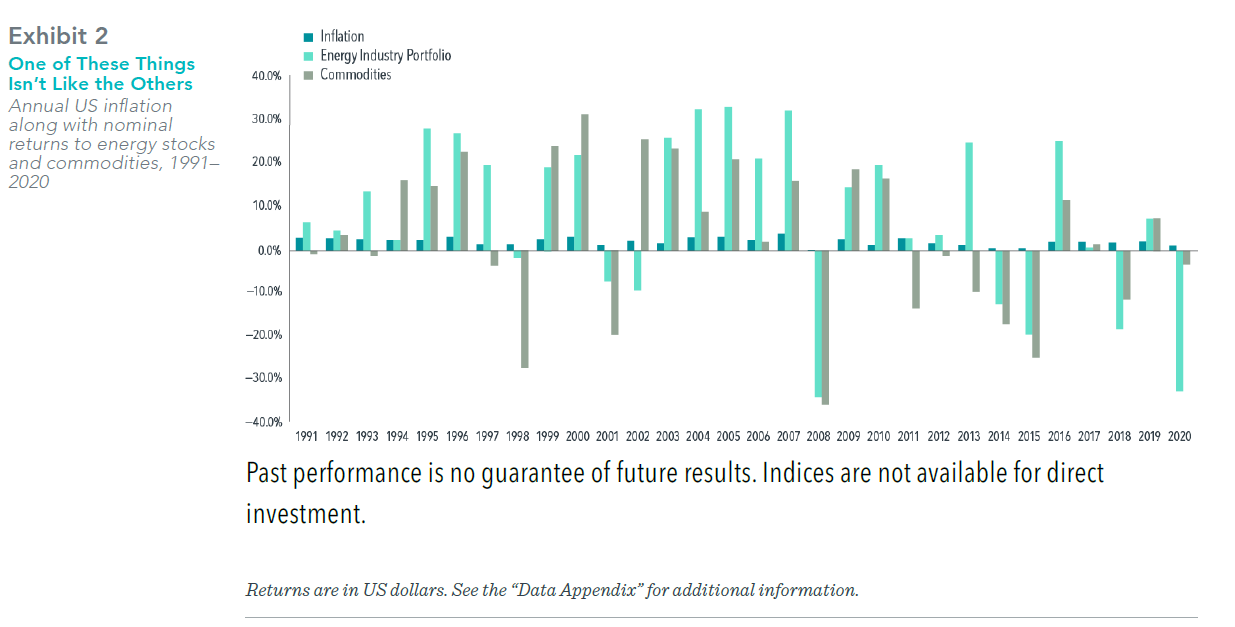
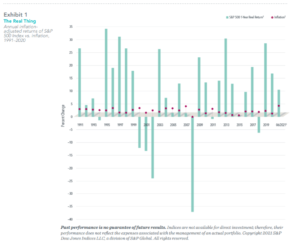
Nominal asset prices already embed the market’s expectation of inflation. So inflation concerns are really about the negative impact of unexpected inflation on the real value of your invested wealth. An asset is therefore most useful as an inflation hedge when its nominal returns move closely with unexpected inflation. In the paper, we find mostly weak correlations between nominal returns and unexpected inflation. For the few exceptions where the correlations are reliable, such as for energy stocks and commodities over 1991–2020, the assets’ nominal returns have been around 20 times as
volatile as inflation, and more than half of their nominal-return variation has been unrelated to inflation. Exhibit 2 illustrates this by showing how the annual nominal returns to energy stocks and commodities differ dramatically from the annual realizations of inflation. If the goal is to reduce the variability of future purchasing power, it is questionable that hedging with something this volatile will effectively achieve that.
 INFLATION DEFLATED
What will next month’s inflation reading be? How will it compare to market expectations? Is the rise in inflation temporary or long-lived? Nobody has a crystal ball. Fortunately, we don’t need a crystal ball to address inflation in our portfolios. The data suggest that simply staying invested helps outpace inflation over the long term. And for those of us who are particularly sensitive to unexpected inflation, the protection offered by inflationindexed securities still appears to be the most effective.
DATA APPENDIX
US inflation
The annual rate of change in the Consumer Price Index for All Urban Consumers (CPI-U, not seasonally adjusted) from the Bureau of Labor
Statistics.
US government securities and long-term corporate bonds. The returns to US government securities (one-month T-bills, five-year notes, and long-term bonds) and long-term corporate bonds are from Morningstar (previously from Ibbotson Associates).
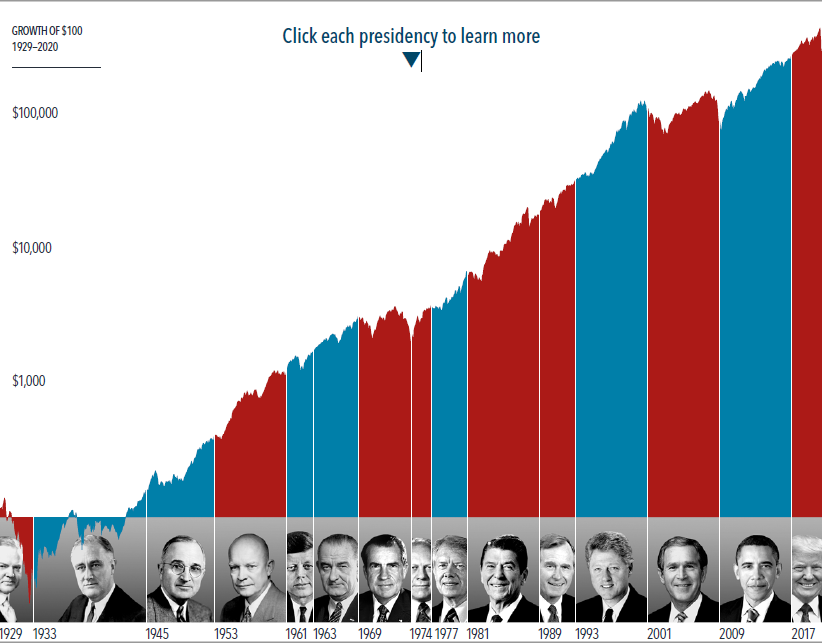
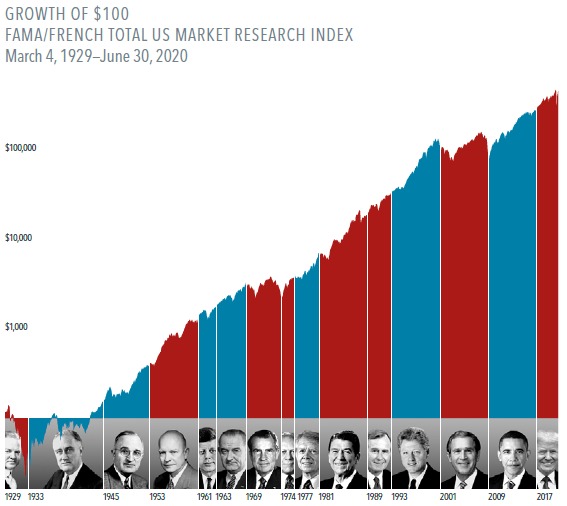
US equity portfolios and factors. The US equity market is proxied by the Fama/French Total US Market Research Index. The US industry portfolios are the 12 Fama/French industry portfolios. The US style portfolios (small cap value and growth and large cap value and growth) are from the Fama/French six portfolios sorted on size (market cap) and book-to-market equity. The US size and value premiums are proxied by the Fama/French size and value factors. The returns to all of the above are from Ken French’s data library: https://mba.tuck.dartmouth.edu/pages/faculty/ken.french/data_library.html.
GLOSSARY
T-bills: Short-term debt issued by the US Treasury Department.
Treasury Inflation-Protected Securities (TIPS): Bonds issued by the US Treasury Department that provide protection against inflation. The
principal of a TIPS increases with inflation and decreases with deflation, as measured by the Consumer Price Index. When a TIPS matures,
the investor is paid the adjusted principal or original principal, whichever is greater.
Inflation swaps: An inflation-swap agreement is a two-sided contract in which one party receives floating payments tied to the actual
inflation rate and pays fixed payments based on expected inflation and the inflation risk premium for a given notional amount and period.
Nominal return: The rate of return on an investment without adjusting for inflation.
Real return: The rate of return on an investment after adjusting for inflation.
By: Wei Dai, PhD -Head of Investment Research and Vice President
Mamdouh Medhat, PhD – Researcher
References: Eugene Fama and Ken French are members of the Board of Directors of the general partner of, and provide consulting services to,
Dimensional Fund Advisors LP.
The information in this document is provided in good faith without any warranty and is intended for the recipient’s background information
only. It does not constitute investment advice, recommendation, or an offer of any services or products for sale and is not intended to provide a sufficient basis on which to make an investment decision. It is the responsibility of any persons wishing to make a purchase to inform themselves of and observe all applicable laws and regulations. Unauthorized copying, reproducing, duplicating, or transmitting of this document are strictly prohibited. Dimensional accepts no responsibility for loss arising from the use of the information contained herein.
“Dimensional” refers to the Dimensional separate but affiliated entities generally, rather than to one particular entity. These entities are Dimensional Fund Advisors LP, Dimensional Fund Advisors Ltd., Dimensional Ireland Limited, DFA Australia Limited, Dimensional Fund Advisors Canada ULC, Dimensional Fund Advisors Pte. Ltd., Dimensional Japan Ltd., and Dimensional Hong Kong Limited. Dimensional Hong Kong Limited is licensed by the Securities and Futures Commission to conduct Type 1 (dealing in securities) regulated activities only and does not provide asset management services.
UNITED STATES: Dimensional Fund Advisors LP is an investment advisor registered with the Securities and Exchange Commission.

 Imagine showing up for your first day of school, in the country in which you were born – having (a) avidly watched Sesame Street daily & (b) being fascinated with being an American cowboy , only to be placed in an ESL (English as a Second Language) class.
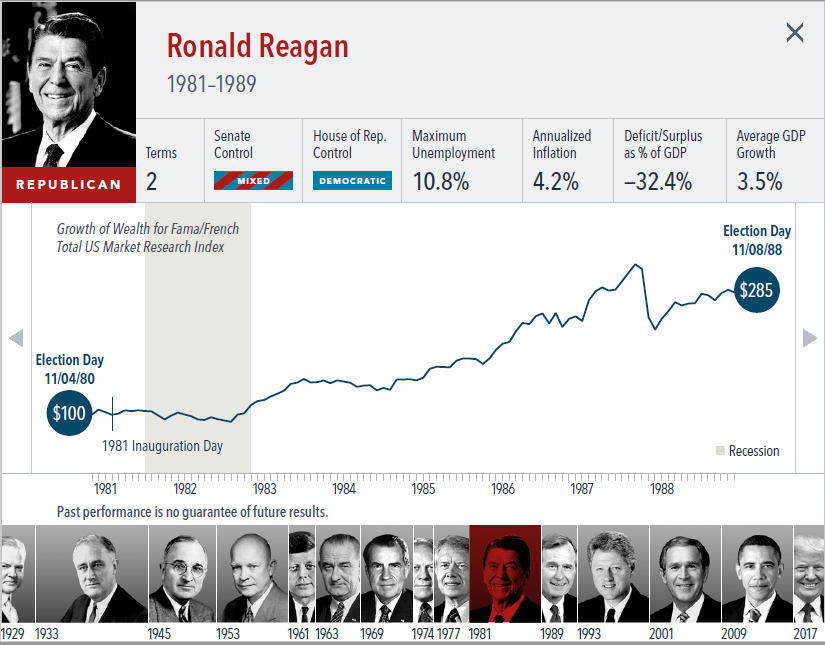
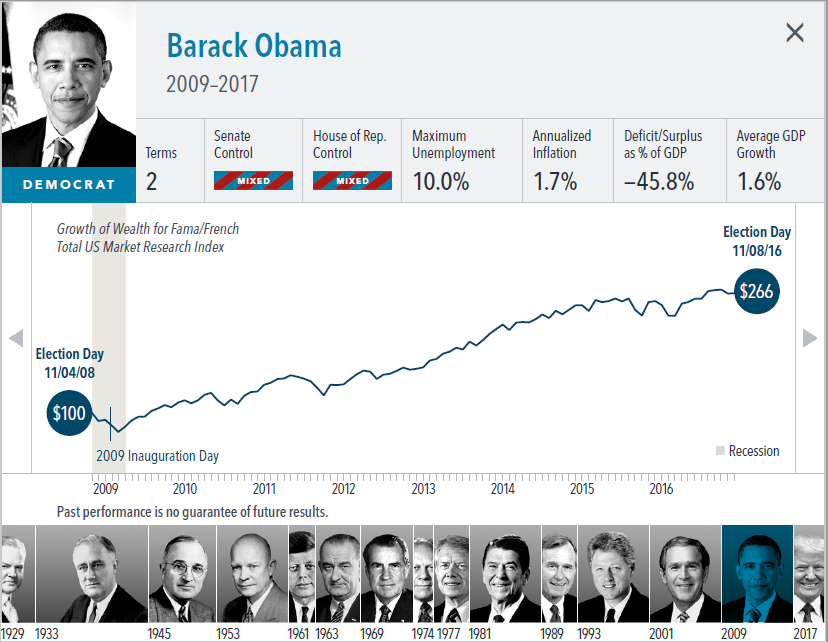
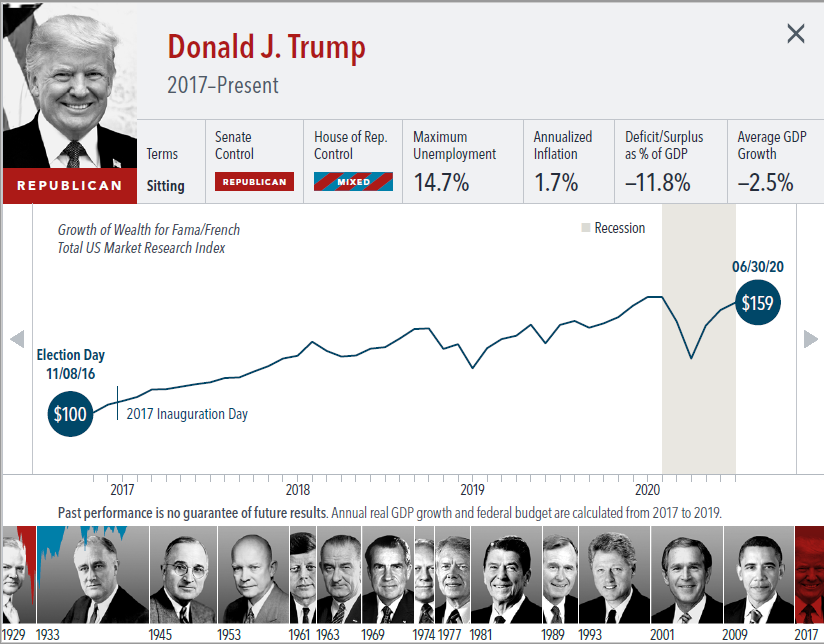
 A look at equity performance in the past three decades does not show any reliable connection between periods of high (or low) inflation and US stock returns.