
KEY TAKEAWAYS
- FANMAG returns have been extreme relative to their contemporaries, but not their predecessors—their performance has been in line with the average top performers throughout US stock market history.
- The FANMAGs were the big winners from a broader group of large tech companies, most of whom have lagged the market.
- Following the popularity of the FAANG stocks, FANMAGs are the current fad. But history suggests fad-based investing is no substitute for broad diversification and a consistent approach.
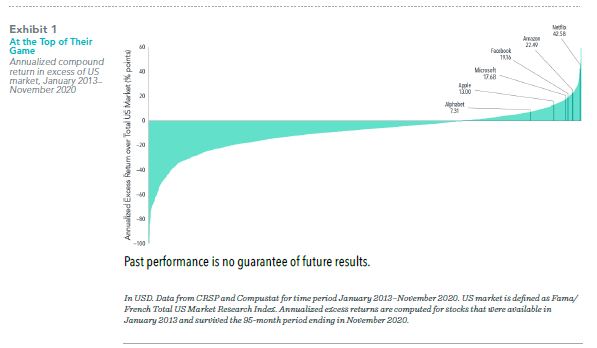
A handful of large technology stocks have garnered attention for outsize returns in recent years. Collectively referred to by the FANMAG acronym, Facebook, Amazon, Netflix, Microsoft, Apple, and Google (now trading as Alphabet) all substantially outperformed the US market1 in the eight calendar years that they have all been public companies (Facebook went public in May 2012).2 Emerging as winners from among a large number of companies that fared less well during 2013–2020,3 these juggernauts bested most of their surviving peers with annualized outperformance versus the US market ranging from 7.31 (Alphabet) to 42.58 percentage points (Netflix), as shown in Exhibit 1.
While this performance dazzled investors and dominated headlines during 2013–2020, a more complete picture emerges when accounting for the many companies whose investors were less fortunate over the period. As shown in Exhibit 2, of the 10 largest US technology stocks as of January 2013, all but Apple, Microsoft, Alphabet, and Amazon underperformed the US market over the same period that elevated their tech peers to financial market stardom.
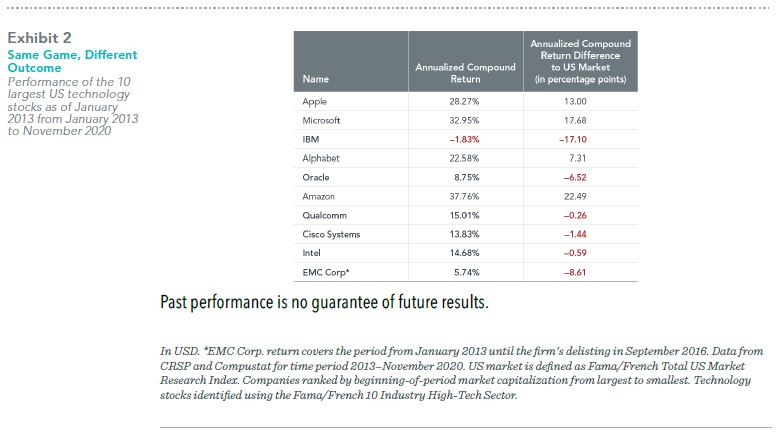
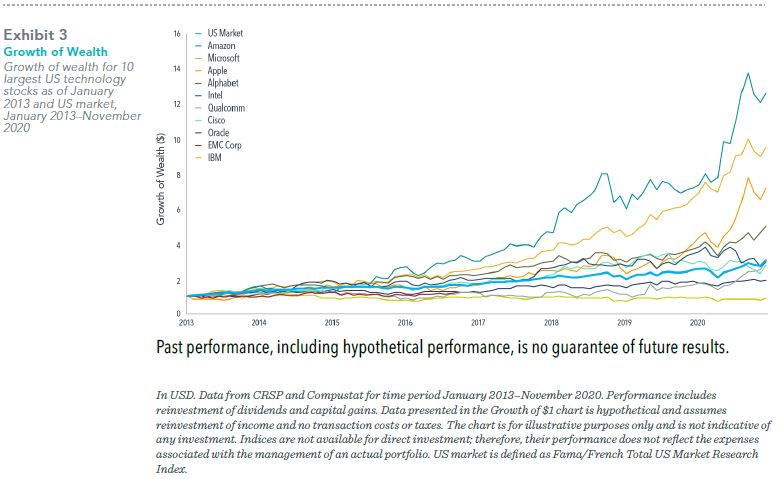
Exhibit 3 shows the hypothetical growth of wealth for an investor who put $1 in each of the 10 largest technology stocks and the US market in January 2013. While the $1 invested in Amazon and Apple, for example, would have grown to $12.63 and $7.18, respectively, by November 2020, the returns of their non-FANMAG tech contemporaries would have failed to even surpass the US market.
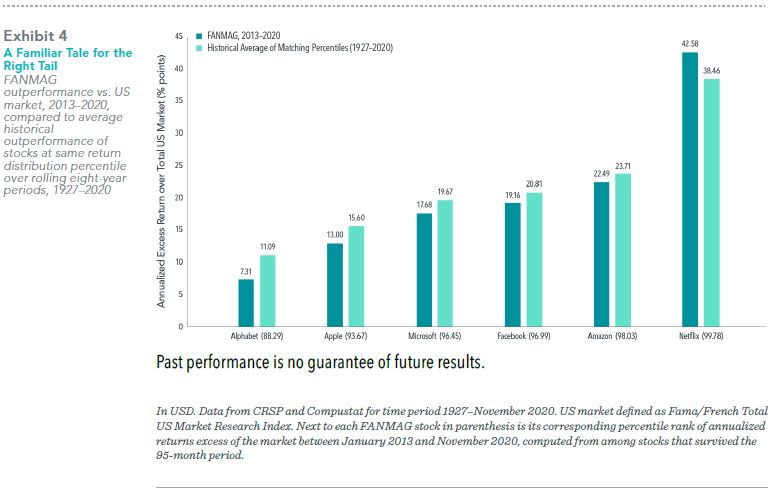
FANMAG returns certainly stand out among those of their contemporaries, but the range of individual stock outcomes has often been immense. A historical look shows that FANMAG performance has been quite ordinary in the context of past top-of-the-market performers. Drawing on stock return data since 1927, Exhibit 4 indicates that historical top performers often experienced larger outperformance relative to the US market than the FANMAG stocks realized during 2013–2020. For example, Apple’s 2013–2020
annualized excess return of 13.00 percentage points places it at the 93.67 return percentile among all US stocks that were trading in January 2013 and survived the eightyear period that followed. However, the average outperformance of stocks at the 93.67 percentile over eight-year rolling periods from 1927 to 2020 was 15.60 percentage points, or about 2.60 percentage points higher. With the exception of Netflix, the same holds for
the other FANMAG stocks, with historical outperformers at the same return percentile outperforming the market by more than the FANMAG stocks did in 2013–2020.
A defining trait of the FANMAG performance is that these outsize returns have come from among the largest companies in the US, implying they were meaningful contributors to the overall US market’s return. However, historical data show that this too is nothing new.
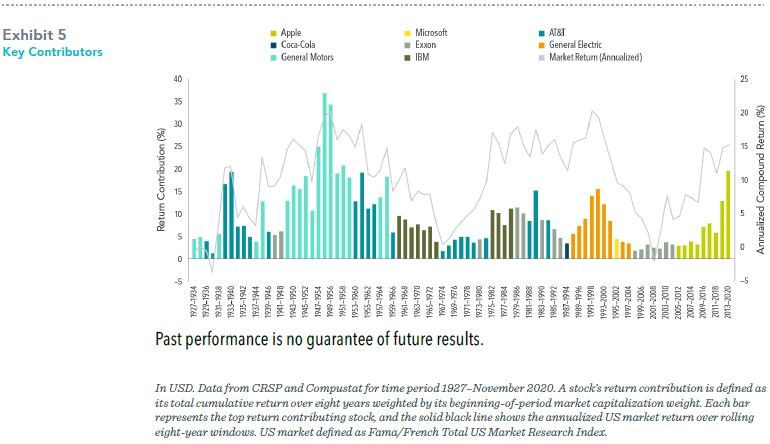
Defining a stock’s return contribution as its total return weighted by its beginning-ofperiod market capitalization weight, we see that Apple’s contribution to the US market for the period 2013–2020 was 19.68%. How does this figure compare to other top return contributors? Exhibit 5 illustrates the top return contribution and the annualized US market return over rolling eight-year periods since 1927, revealing instances of return contributions by the likes of AT&T, General Motors, and General Electric that were
comparable to, or even exceeded, that of Apple in 2013–2020.
FOTW (FLAVOR OF THE WEEK)
If history is any guide, the FANMAG acronym will eventually be replaced by another trendy name. For example, stock market historians will remember the Nifty Fifty in the 1960s and 70s, a set of 50 blue-chip stocks like Coca-Cola and General Electric. The early 2000s witnessed increasing adoption of the acronym BRIC, representing investment opportunities in the fast-growing emerging economies of Brazil, Russia, India, and China. More recently, the WATCH companies—Walmart, Amazon, Target, Costco, and Home Depot—have also gained traction in the market’s lexicon.
While documenting trends in finance is entertaining, there is little evidence that investors can spot these trends in advance in a way that would enable market-beating performance. Moreover, concentrated bets on high-flying stocks can expose investors to idiosyncratic risks and a wider range of possible outcomes. By contrast, a sound investment approach based on financial science emphasizes the importance of broadly diversified portfolios that provide exposure to a vast array of companies and sectors to help manage risks, increase flexibility in implementation, and increase the reliability of outcomes.
– Kenneth French, PhD
Director and Consultant
_____________________________________________________________________
Resources: The information in this document is provided in good faith without any warranty and is intended for the recipient’s background information
only. It does not constitute investment advice, recommendation, or an offer of any services or products for sale and is not intended to provide a sufficient basis on which to make an investment decision. It is the responsibility of any persons wishing to make a purchase to inform themselves of and observe all applicable laws and regulations. Unauthorized copying, reproducing, duplicating, or transmitting of this document are strictly prohibited. Dimensional accepts no responsibility for loss arising from the use of the information contained herein. “Dimensional” refers to the Dimensional separate but affiliated entities generally, rather than to one particular entity. These entities are Dimensional Fund Advisors LP, Dimensional Fund Advisors Ltd., Dimensional Ireland Limited, DFA Australia Limited, Dimensional Fund
Advisors Canada ULC, Dimensional Fund Advisors Pte. Ltd, Dimensional Japan Ltd., and Dimensional Hong Kong Limited. Dimensional Hong Kong Limited is licensed by the Securities and Futures Commission to conduct Type 1 (dealing in securities) regulated activities only and does not provide asset management services. Named securities may be held in accounts managed by Dimensional. This information should not be considered a recommendation to buy or
sell a particular security.
UNITED STATES: Dimensional Fund Advisors LP is an investment advisor registered with the Securities and Exchange Commission.
CANADA: These materials have been prepared by Dimensional Fund Advisors Canada ULC. Commissions, trailing commissions, management
fees, and expenses all may be associated with mutual fund investments. Unless otherwise noted, any indicated total rates of return reflect the
historical annual compounded total returns, including changes in share or unit value and reinvestment of all dividends or other distributions, and do not take into account sales, redemption, distribution, or optional charges or income taxes payable by any security holder that would have reduced returns. Please read the prospectus before investing. Mutual funds are not guaranteed, their values change frequently, and past performance may not be repeated.
AUSTRALIA and NEW ZEALAND: This material is issued by DFA Australia Limited (AFS License No. 238093, ABN 46 065 937 671). This material
is provided for information only. No account has been taken of the objectives, financial situation or needs of any particular person.